

Australian organisations rely on smart dashboards to turn raw data into real insights. The right reporting tool makes all the difference in daily decision-making, risk management and growth planning. Comparing Microsoft Power BI and Google Looker isn’t just a technical choice-it shapes how well leaders can respond to business challenges.
Power BI stands out ahead of Google Looker for dashboarding, especially for Australian teams needing strong local support and reliable integration with day-to-day business tools. Many executives and finance leaders find Power BI delivers sharper insights, quicker setup and more flexible reporting options that match real-world needs. As a Perth-based expert, SolveBI helps organisations get the most from Power BI dashboards, bringing years of hands-on experience in data integration and reporting. You’ll see how choosing the right platform supports smarter, faster decisions across your business.
Overview of Microsoft Power BI and Google Looker
When executives compare dashboard tools, Microsoft Power BI and Google Looker are often at the top of the shortlist. Both are known names in business intelligence, yet their strengths, user experience, and flexibility can differ in big ways. Understanding the basics helps leaders make the right move for smarter, faster reporting.
Key Features and Functions
Power BI and Looker cover the dashboarding basics, but their approach and flexibility aren’t equal. Here’s what you can expect:
Microsoft Power BI:
- Intuitive dashboard building: Drag-and-drop design, flexible layouts, and a wide range of visual options suit users from finance to operations.
- Strong data modelling: Power BI shines with features like DAX (Data Analysis Expressions). Complex business logic, KPIs, and multi-layered calculations are simple to implement for daily reporting or board packs.
- Customisation: Users can tailor visuals, apply conditional formatting, and build branded dashboards to match company standards.
- Collaboration and sharing: Integration with Microsoft 365 means it’s easy to comment, export, and distribute insights securely across teams.

Google Looker:
- Modular dashboard creation: Users set up dashboards from pre-existing blocks, but custom visual choices are more limited than Power BI.
- Centralised data modelling: Looker uses LookML, a modelling language that suits data engineers and IT teams. It’s powerful, but often requires more technical skill.
- Customisation: Offers flexibility at the data model level, but less so in finished dashboards unless you have advanced tech skills.
- Sharing and collaboration: Strong for web sharing and embedding, but can lag behind Power BI for tight integration with everyday business tools.
When dashboard flexibility and custom business metrics matter, Power BI stands out. It’s built for non-technical users as well as analytics pros, letting every team own their reporting experience.
Integration and Data Connectivity
How well a dashboard connects to your existing data is more important than ever. Both platforms hit the basics, but the difference in reach and ease sets them apart.
Power BI:
- Extensive data connectors: Direct links to Microsoft SQL Server, Azure, Excel, and hundreds more. Integrates naturally within the Microsoft ecosystem, and connects smoothly with third-party sources like Salesforce, SAP, and cloud platforms.
- Real-time data feeds: Live dashboards are easy to set up, so leaders never have to wait for a refresh. Whether pulling sales data, stock levels, or operational stats, Power BI keeps the pulse beating fast.
- Enterprise-scale compatibility: Power BI aligns with services used across finance, construction, manufacturing and beyond-key for Australian businesses juggling multiple platforms.
Google Looker:
- Strong cloud data support: Natively connects to Google BigQuery and other cloud databases. Works well for Google Cloud-first organisations.
- APIs and external connectors: Can tie into external SQL sources and APIs, but setup is often more technical and time-consuming.
- Real-time capability: Handles streaming data but typically requires advanced configuration by IT.
For teams that rely on seamless, ready-to-use data integration, Power BI feels noticeably smoother. It’s designed to save managers’ time, reduce IT dependency, and allow faster insights-especially vital for leadership needing accurate, up-to-the-minute reporting. For a closer look at how strong integration supports business decision-making, explore the advantages of Power BI for Australian organisations.
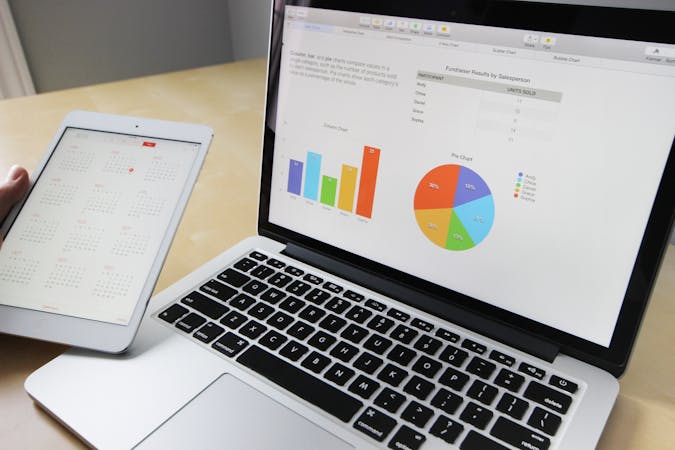
Photo by Andrea Piacquadio
For companies wanting to bring together financial, operational, and customer data without the pain of manual workarounds, Power BI delivers stronger connectivity, faster setup, and more intuitive dashboarding than Google Looker. If your business demands clear, flexible, and reliable reporting, Power BI is built to deliver.
Comparison: Dashboard Visualisation and User Experience
Comparing Microsoft Power BI and Google Looker side by side on dashboard visualisation and user experience quickly highlights where Power BI stands out. For busy leaders and teams, being able to build, customise, and share dashboards confidently is not just a “nice-to-have”, it’s essential for daily results and trust across the business. The following breakdown gives you a clear view of what each tool offers, so it’s easier to judge which platform lines up with your organisation’s needs.
Customisation and Visual Options

Photo by Lukas
When it comes to customising dashboards and visuals, Power BI puts the keys in your hands, whether you’re an analyst or a decision-maker.
Power BI:
- Wide Range of Visualisation Styles: From simple bar and line charts to advanced interactive visuals like maps, gauges, and decomposition trees, Power BI caters to all users.
- Custom Visual Marketplace: The Power BI Visuals Marketplace offers hundreds of additional visuals built by both Microsoft and third parties, so you’re never stuck with the basics. Everything from financial waterfall charts to bespoke KPI widgets can be added in a few clicks.
- Brand Integration: Power BI makes it simple to match company branding. You can import custom themes, use your organisation’s colour palettes, and even add logos for a unified look in boardroom settings.
- Formatting and Interactivity: Detailed control lets you tweak data labels, tooltips, and user interactions like filtering, drilling, and highlighting. The experience feels polished, logical, and engaging.
Google Looker:
- Standard Visual Options: Looker’s out-of-the-box visualisations are clean but limited compared to Power BI. There are basic chart types and some interactivity but little in the way of deep customisation unless you code.
- Custom Looks: While Looker does let advanced users build custom Looks and visual tweaks via LookML, it generally asks for developer effort.
- Branding: Adding branding, changing themes, or controlling dashboard layout is less intuitive and can be restrictive, especially for business teams who want to stand out.
For organisations where first impressions and clear storytelling matter, Power BI makes it easier to create dashboards that not only inform but impress. Its drag-and-drop nature, plus a mature extension marketplace, supports any reporting need from high-level management packs to granular operational tools.
For a closer look at practical Power BI dashboard design possibilities, Power BI dashboard design for Perth organisations gives real-world ideas and inspiration for businesses across industries.
Collaboration, Sharing, and Security
Building the right dashboard is only the start-confident sharing and strong access control turn business intelligence into true business value.
Power BI:
- Smooth Sharing: Dashboards can be published securely to specific colleagues or teams, whether they use the web, desktop, mobile app, or even Microsoft Teams. Users choose who sees what down to a report or dataset level.
- Workspaces and Roles: Power BI makes team collaboration straightforward through shared workspaces. Role-based access ensures everyone only sees what they need, supporting compliance and confidentiality.
- Organisational Security: Power BI integrates tightly with Microsoft security practices, and includes features like multi-factor authentication, row-level security, and detailed audit logs. This means even sensitive financials or HR data remains protected, meeting corporate and regulatory demands.
Google Looker:
- Sharing Options: Looker allows users to share dashboards by link or embed them in web pages, but the workflow relies more on managing permissions inside Google Cloud.
- Access Control: While Looker does support granular user permissions, the set-up can be less intuitive and, for complex organisations, may need IT or admin intervention.
- Security Practices: Looker follows cloud-first security protocols through Google Cloud. However, organisations using a mix of platforms may find tighter alignment and control with Power BI’s integration into the broader Microsoft environment.
Strong dashboard sharing and strict security are a baseline, not a bonus. Power BI delivers on both fronts, giving business leaders peace of mind and the flexibility to empower teams without risking data access. For businesses with advanced security requirements or audits, choosing a platform backed by Microsoft’s compliance standards makes day-to-day control noticeably simpler.
Resources such as this comparison on Power BI and security features from Google Cloud can help with due diligence, but for many Australian businesses, Power BI’s alignment with Microsoft standards gives it a clear edge.
Pricing, Licensing, and Scalability Considerations
Choosing the right business intelligence tool means looking past flashy dashboards-you want transparent pricing, flexible licensing, and a solution that grows with your business. Cost surprises, license confusion, or rigid capacity can create roadblocks, making it essential to weigh these factors early. Let’s break down what Microsoft Power BI and Google Looker offer Australian organisations when it comes to pricing, licensing, and scaling up.
Power BI: Transparent Pricing and Enterprise Flexibility

Photo by RDNE Stock project
Power BI stands out for its simple pricing and scalable structure, letting Aussie businesses pay only for what they use.
- Tiered Subscription Options: Individuals can start free, while growing teams can tap into paid subscriptions such as Power BI Pro (per user) or Power BI Premium (per user or per capacity). This means you’re not forced to overcommit upfront.
- Power BI Pro is ideal for small to mid-sized teams needing full collaboration.
- Power BI Premium unlocks advanced AI, bigger datasets and on-premises reporting-great for large-scale organisations or those with heavy usage.
- Licensing That Fits: Microsoft’s licensing covers every user type, from basic report viewers to advanced report creators. You can see a summary of licence types for business users in the official Microsoft guide.
- Predictable Costs: Power BI’s pricing is public and straightforward. Updates or expansions don’t come with hidden fees, which keeps budgeting stress-free for finance leaders. Find the latest pricing details on the Microsoft Power BI pricing page.
For many Australian companies, this clear approach helps avoid unexpected spend and ensures stakeholders can access dashboards without red tape. Scaling from a handful of users to thousands is easy-just assign or upgrade licences as your needs grow.
Google Looker: Complex Licensing and Cloud-First Scaling
Google Looker takes a different approach, often appealing to organisations already entrenched in the Google Cloud ecosystem.
- Custom User-Based Pricing: Looker uses a user-based model, with pricing determined by type of user access (viewer, editor) and overall compute usage. This can offer flexibility but usually leads to more back-and-forth with sales, particularly for larger-scale deployments. Latest details can be checked on the Looker pricing page.
- Licensing Terms: Understanding what you’re allowed to do-how many dashboards, what data volumes, and how many viewers-isn’t always obvious. Every enterprise will need to review the official Looker licensing descriptions before making a commitment.
- Scalability Focused on the Cloud: Looker is built for cloud scale, especially around Google BigQuery. While this works if you’re fully committed to Google Cloud, businesses in hybrid environments might find costs rise quickly with cross-cloud data movement.
Scalability: Meeting Today’s and Tomorrow’s Needs
In business intelligence, scalability isn’t just about bigger databases-it’s about adding users, managing costs, and making sure performance keeps up as your company grows or pivots.
A few factors to assess:
- Seamless User Expansion: Power BI makes it simple to add users or move up to capacity-based licensing without disruption. Azure’s backbone means you can handle everything from daily board packs to enterprise-scale analytics.
- Hybrid and On-Prem Options: Power BI also supports hybrid models, giving you on-premises options where data residency or compliance is critical.
- Cost Controls: The predictability in Power BI’s licensing model lets organisations set clear budgets and forecasts, vital for CFOs who value cost control with no nasty surprises.
For additional tips on preparing for scale while maintaining reporting performance, see how tailored Power BI solutions can grow with your business needs through the expertise at SolveBI.
Google Looker’s focus on cloud scalability may be suitable for cloud-focused companies, but complexity and ambiguity in licensing often add to ongoing management headaches.
A clear, cost-effective, and scale-friendly structure gives Power BI the edge for executives who want more certainty and room to grow-without compromising daily operations or strategic agility.
Use Cases and Industry Examples
Power BI’s reputation as a dashboard leader comes from how it adapts to different business environments. From finance to logistics and hospitality, Power BI empowers decision-makers to move faster and smarter, while Google Looker tends to lag in both flexibility and adoption. The advantages become clear when you look at practical, real-world use.
Finance Sector Analytics with Power BI

Photo by Tima Miroshnichenko
Finance teams need fast, reliable access to real-time data. Power BI dashboards are built for CFOs, finance managers, and analysts who want a clear financial snapshot without waiting on IT. Key benefits include:
- Live financial reporting: Get up-to-date visibility on cash flow, forecasts, and P&L. Power BI pulls data from accounting systems and ERPs with ease.
- Drill-through capability: Zoom from high-level summaries down to transaction-level details in seconds, supporting executive reviews, audits, and compliance.
- Automated KPI tracking: Set up alerts for critical financial indicators so leaders know immediately when action is needed.
- Scenario analysis: Assess “what if” situations with interactive visuals and toggles, empowering finance teams to test growth, risk, and expenditure plans effortlessly.
Bankers, accountants, and asset managers appreciate how Power BI’s flexible dashboards replace manual spreadsheets and help teams meet deadlines. These solutions drive better strategy with complete confidence and transparency.
To explore more about industry-specific dashboards, visit the Finance Industry Solutions page for an in-depth look at how Power BI is changing finance analytics: Finance Industry Solutions.
Other Industry Examples: Logistics and Hospitality
The impact of effective dashboards goes far beyond financial services. In logistics, Power BI brings clarity to shipment tracking, order fulfilment, and resource allocation. In hospitality, it turns raw guest data and operational metrics into actionable insights for managers.
For logistics and transportation:
- End-to-end visibility: Track freight, manage routes, and monitor bottlenecks in real-time, minimising delays and optimising resources.
- Driver performance and safety monitoring: Identify trends, high performers, and issues fast, which helps reduce risk.
- Dynamic demand forecasting: Use data visualisation for supply chain planning and capacity management.
See practical examples of these benefits on the Logistics and Transportation Solutions page: Logistics and Transportation Solutions.
In hospitality businesses:
- Guest satisfaction metrics: Combine guest feedback, booking data, and service metrics into a single view to improve everyday operations.
- Inventory management: Monitor stock levels, wastage, and order patterns instantly to cut costs and boost service.
- Revenue tracking: Visualise income streams, seasonal demand, and supplier costs for stronger profit management.
Hospitality leaders relying on Power BI find it easier to respond in real time, streamline operations, and personalise guest experiences. For more examples, check out the Hospitality industry solutions resources to see what Power BI delivers to accommodation, food, and events businesses: Hospitality industry solutions.
Putting dashboards to work in these sectors highlights why Power BI stands in front-offering clear, action-ready insights and advanced features at a scale Google Looker struggles to match.
Choosing the Right Dashboard Tool for Your Organisation
Selecting a dashboard tool is not just an IT decision-it is a business decision that shapes your ability to act on data, drive accountability, and stay ahead of challenges. With so many technology choices on the market, leaders must weigh practical factors before making the call. Here’s what to consider when comparing Microsoft Power BI and Google Looker for your organisation’s dashboard needs.

Photo by Egor Komarov
Alignment with Existing Systems
The best dashboard tool connects smoothly with your existing technology, from your email suite to your cloud storage and financial systems.
- Power BI sits at the heart of the Microsoft ecosystem. It connects naturally with Excel, Teams, Azure services, and hundreds of other data sources both on-premises and in the cloud. This means less friction, faster rollout, and a lower learning curve. For many Australian businesses already using Microsoft 365, this compatibility pays off every day.
- Google Looker, on the other hand, is designed first for organisations who already rely heavily on Google Cloud and BigQuery. If most of your data lives within Google products, it can make sense. Otherwise, integrating Looker often feels more complex and can create long IT to-do lists.
Before making a choice, map out your data landscape and see where each tool fits-or struggles-to connect, especially as your needs grow.
User Accessibility and Skill Levels
For dashboards to create value, teams must be able to access, build, and update them without always turning to IT specialists.
- Power BI’s drag-and-drop interface puts reporting power into the hands of business users, not just analysts or coders. With broad self-service features, staff at all levels can build visuals and make updates in minutes, helping close the gap between data and action.
- Looker’s platform requires stronger technical background, especially with its reliance on LookML for modelling new reports. This means a steeper learning curve. Many organisations find this restricts dashboard ownership to a small circle of data engineers.
Easy-to-use tools not only save time but empower staff to drive business improvements themselves. For step-by-step guidance on building user-friendly dashboards, the Power BI dashboard design service is an excellent resource for Australian organisations.
Security, Compliance, and Data Governance
Security is not negotiable, especially in sectors like finance, healthcare, or government. Australia’s data and privacy laws require strong protection and clear audit trails.
- Power BI stands out with tight integration into Microsoft’s security framework. Features such as multi-factor authentication and row-level security make it easier to enforce policy and restrict data by role or region. Metropolitan, regional, or remote-your data is protected and your compliance easier to prove.
- Google Looker leverages Google Cloud security. While robust, it often requires more technical setup to match the fine-grained controls available natively in Power BI.
For details on how Power BI ensures compliance in regulated industries, see the range of industry solutions developed to support Australian businesses.
Scalability and Cost Predictability
Every organisation is unique, and needs shift as projects, staff, and data volumes grow. Being able to scale-without price shocks-is crucial.
- Power BI offers clear, transparent pricing and easy switches between user-based and capacity-based licensing. Start small and grow comfortably, knowing what you’ll pay each step of the way.
- Looker typically involves contacting Google sales and often results in complex pricing-with costs rising as usage does. This makes budgeting awkward as your business grows.
For a broader look at how dashboard tools compare on value, you can explore this dashboard platforms comparison featuring leading global vendors.
Local Support and Community
Responsive support can make or break your dashboard project, especially when working against deadlines or facing unexpected data challenges.
- Power BI benefits from strong Australian user groups, partners, and a deep pool of Microsoft-certified consultants. Issues are often solved quickly with well-documented help and peer advice.
- Looker’s support is more dependent on Google’s centralised channels and may lack the same local focus or third-party expertise, especially outside major cities.
If a quick solution is important, choosing a tool with strong community backing like Power BI can save both time and money. For professional support tailored to your sector, SolveBI’s consulting services deliver local expertise and ongoing project help.
Choosing the right dashboard tool should feel strategic, not risky. By focusing on fit, user accessibility, security, scalability, and support, Power BI offers the all-round strength that suits most Australian businesses-especially those who want to move quickly while staying secure.
Conclusion
Power BI provides a stronger, more intuitive dashboard experience compared to Google Looker. Its broad customisation, reliable data integration, and predictable licensing suit Australian organisations needing flexibility and control across every level. Looker relies on technical skills and works best for teams deeply tied to Google Cloud, but often brings higher complexity and less straightforward support.
Perth-based businesses choosing Power BI gain the benefits of local consulting, fast deployment and tailored solutions for finance, logistics, hospitality and more. Expert advice from partners like SolveBI helps you make the most of these strengths, from initial strategy to ongoing dashboard support. For tailored consulting that turns reporting into a business asset, explore the full range of Power BI Solutions by SolveBI.